Leave a Message

Thank you for your message. I will be in touch with you shortly.


From dream homes to delicious recipes, my world is just a click away!
Come see what I’m cooking up in real estate (and in the kitchen). you’ll love what you find! visit:
karinfreiman.com https://karinfreiman.com/or scan this QR
code to explore!
If you’ve been following me on social media, you probably saw that I sold my beautiful listing in just 7 days and for $100K over asking!
I’m so happy for my amazing clients who trusted me completely. This one was special, not just because of the quick sale, but because of the relationships built along the way.
Grateful to do what I love, with people I care about.
 
Summary of May's report:
 
National Highlights (March 2025):
• Home prices rose 2.75% year-over-year.
• Mortgage rates dropped slightly to 6.63%.
• Sales volume dipped 2.43% compared to last year.
• Inventory surged 20%, with sellers finally listing homes despite rates.
• New listings continue rising as sellers lose hope for lower rates.
• Buyers may find opportunity as rates gradually decline and inventory grows.
 
Local Focus – Santa Cruz & Silicon Valley (April 2025):
• Santa Cruz home prices fell 8.57% year-over-year, ending a year-long streak of gains.
• Inventory is soaring: up 30% for single-family homes and 51% for condos.
• Homes still sell fast: median days on market is 8 in Santa Clara, 11 in San Mateo, and 15 in Santa Cruz.
• Market type:
Santa Clara & San Mateo: Seller’s market (1.7 months of inventory).
• Santa Cruz: Buyer’s market (3.5 months for single-family; 5.6 for condos).
Condos overall: Buyer’s market across all three counties.
- Karin Freiman, LIC #02201784
The Big Story
Quick Take:
  • Median purchase price continues to tick up, increasing by 2.75% on a year-over-year basis nationwide.
  • The average 30-year mortgage rate continues to slowly fall, reaching 6.63% in the month of March.
  • The number of sales has declined slightly, while inventory skyrocketed on a year-over-year basis.
 
Note: You can find the charts & graphs for the Big Story at the end of the following section.
*National Association of REALTORS® data is released two months behind, so we estimate the most recent month's data when possible and appropriate.
 
 
Inventories levels explode while existing home sales decline slightly
Although we’re still at the point in the season where inventories are supposed to build, they have increased by nearly 20% on a year-over-year basis, from 1,110,000 to 1,330,000, showing that people are hesitant to purchase a new home. Additionally, while inventories have been increasing, the number of existing homes being sold has decreased slightly on a year-over-year basis, with March 2025 numbers coming in at 4,020,000, which is 2.43% lower than where they were last year. Across the country, people are becoming more uncertain of whether or not they should move to a new home, and that is very clearly showing!
 
This data is just for March though; it will be important to pay attention to how the market reacted to the beginning of the trade war when April’s numbers come out in a couple of weeks. While it’s easy to see how things like the stock market and bond market react to big newsworthy events like this, real estate is incredibly illiquid, so it takes some time for things to play out!
 
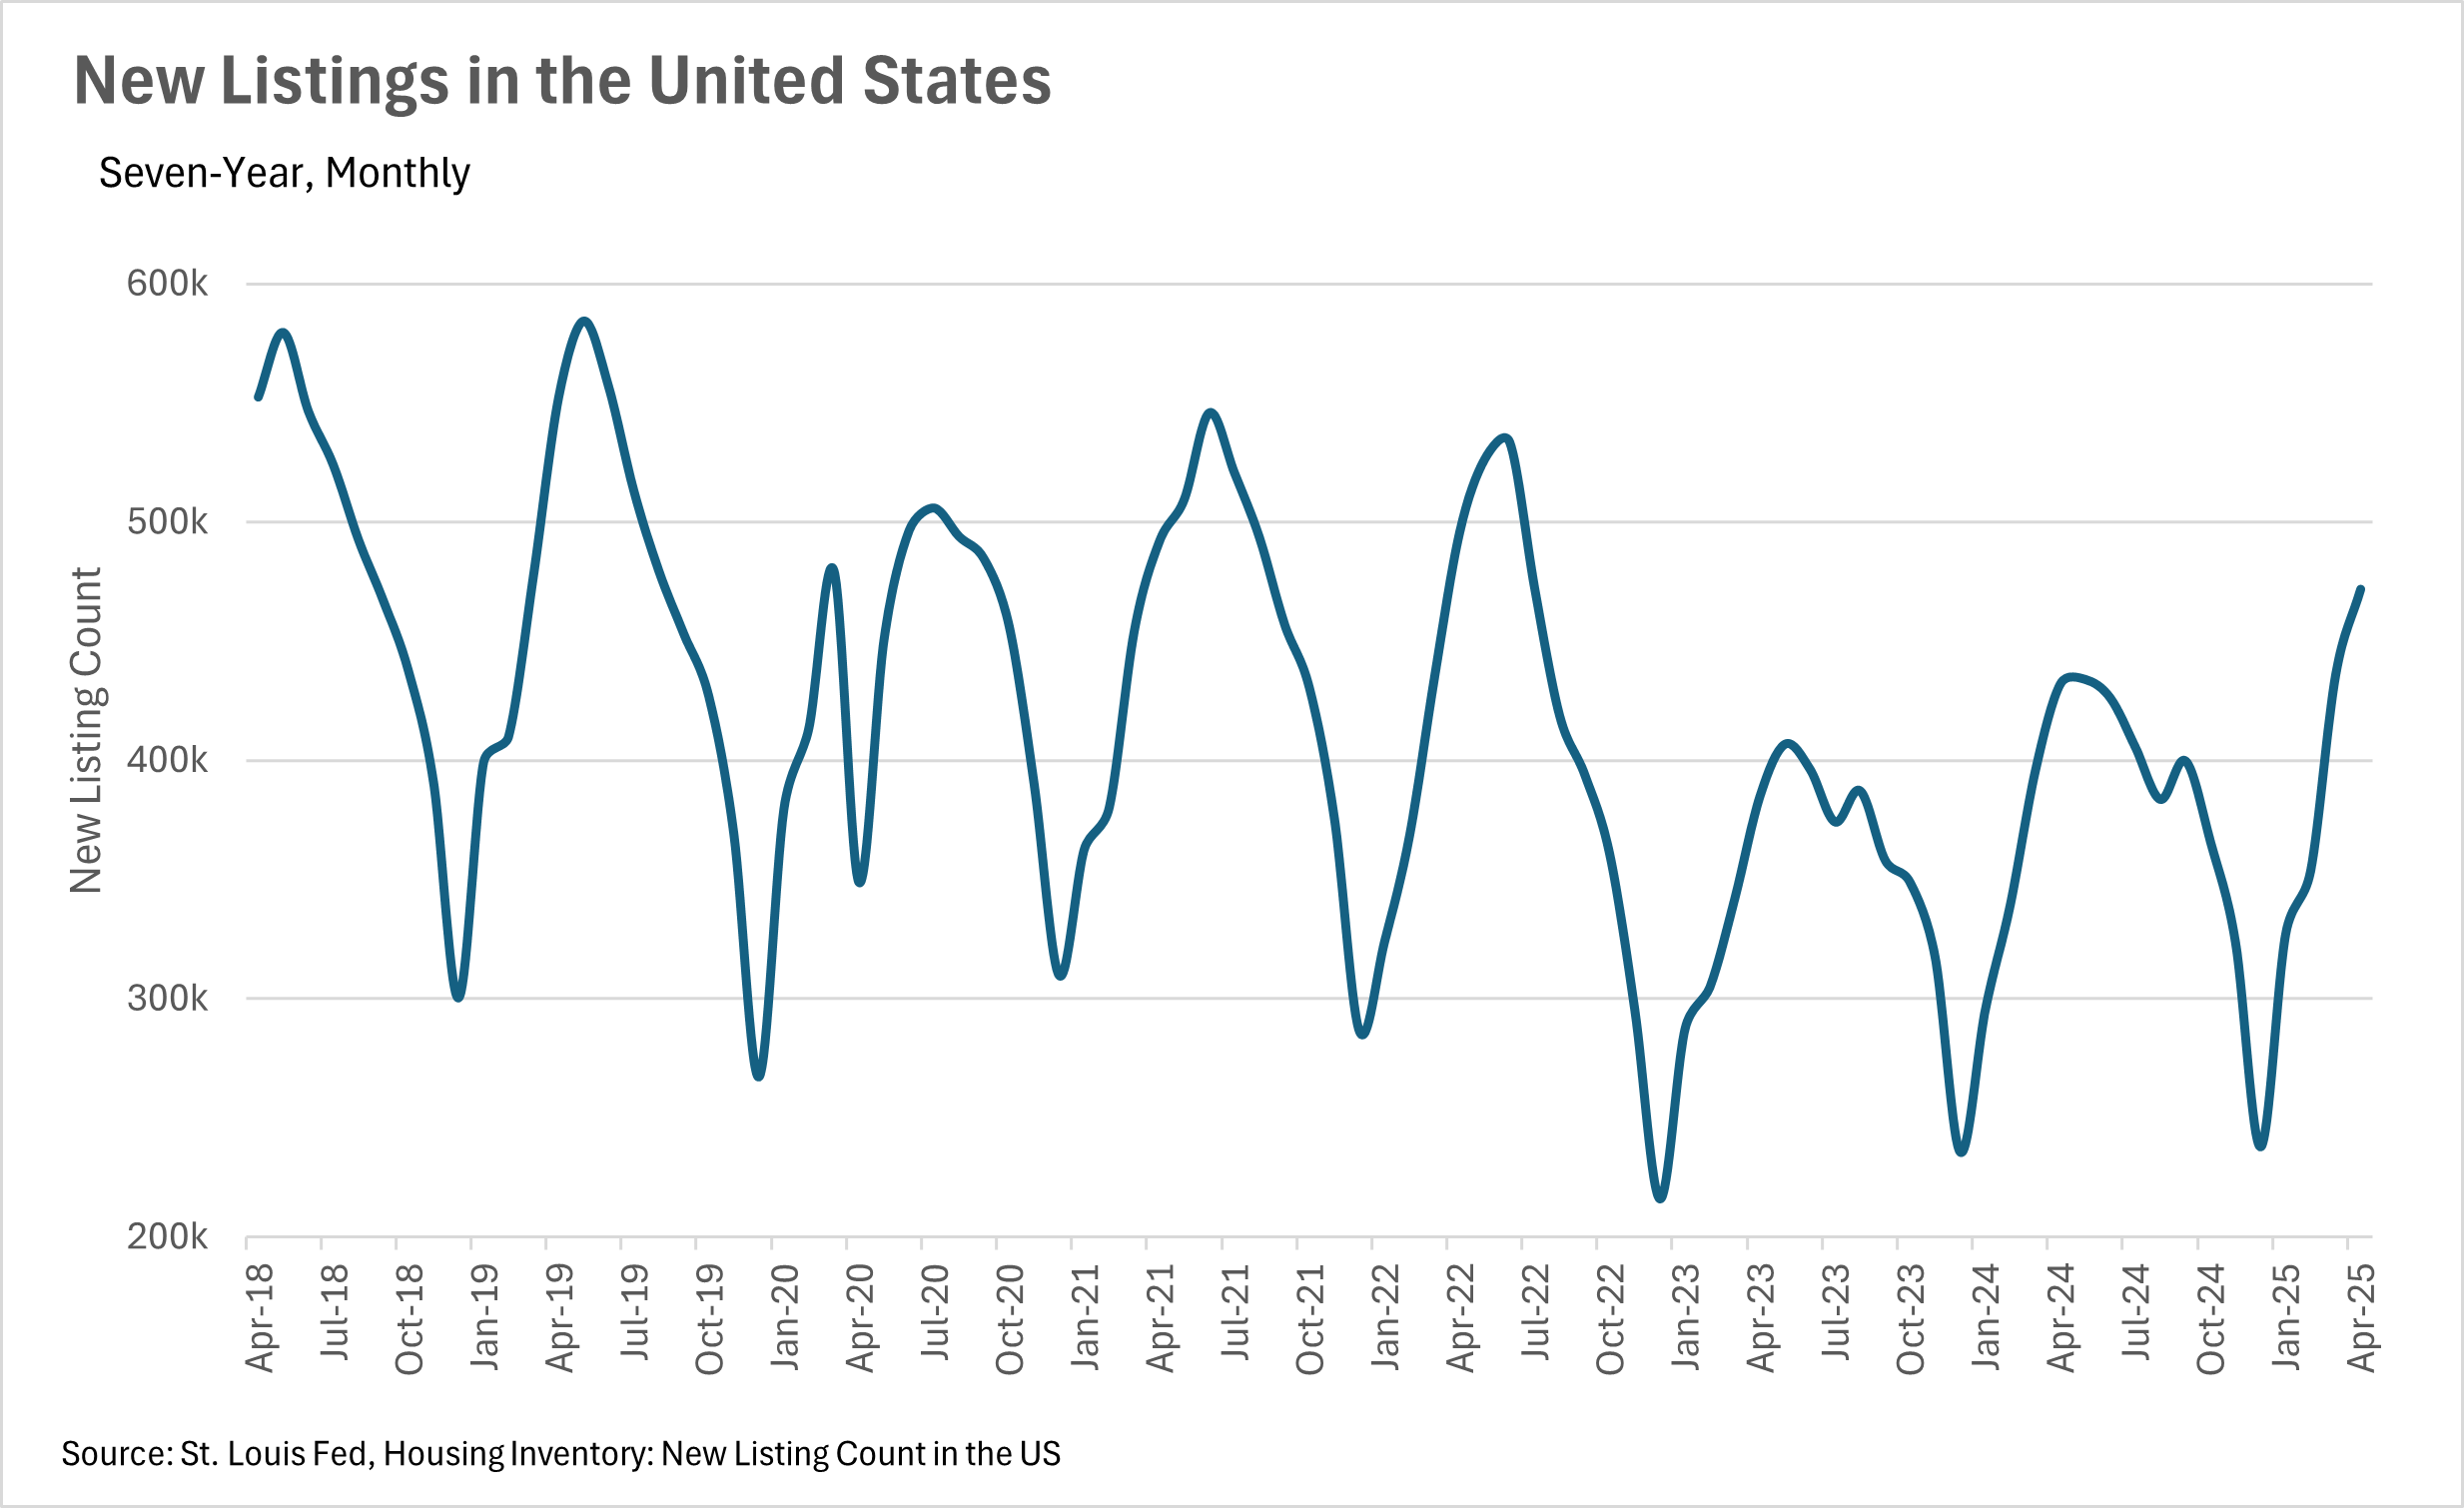
As you might have expected, there was a considerable increase in the number of listings that have hit the market too. For a few months in a row we have seen high single/low double-digit percentage growths in the number of new listings hitting the market in the US. This is likely due to the fact that the people who were holding out for the return of lower interest rates are losing hope, and listing their homes anyway.
 
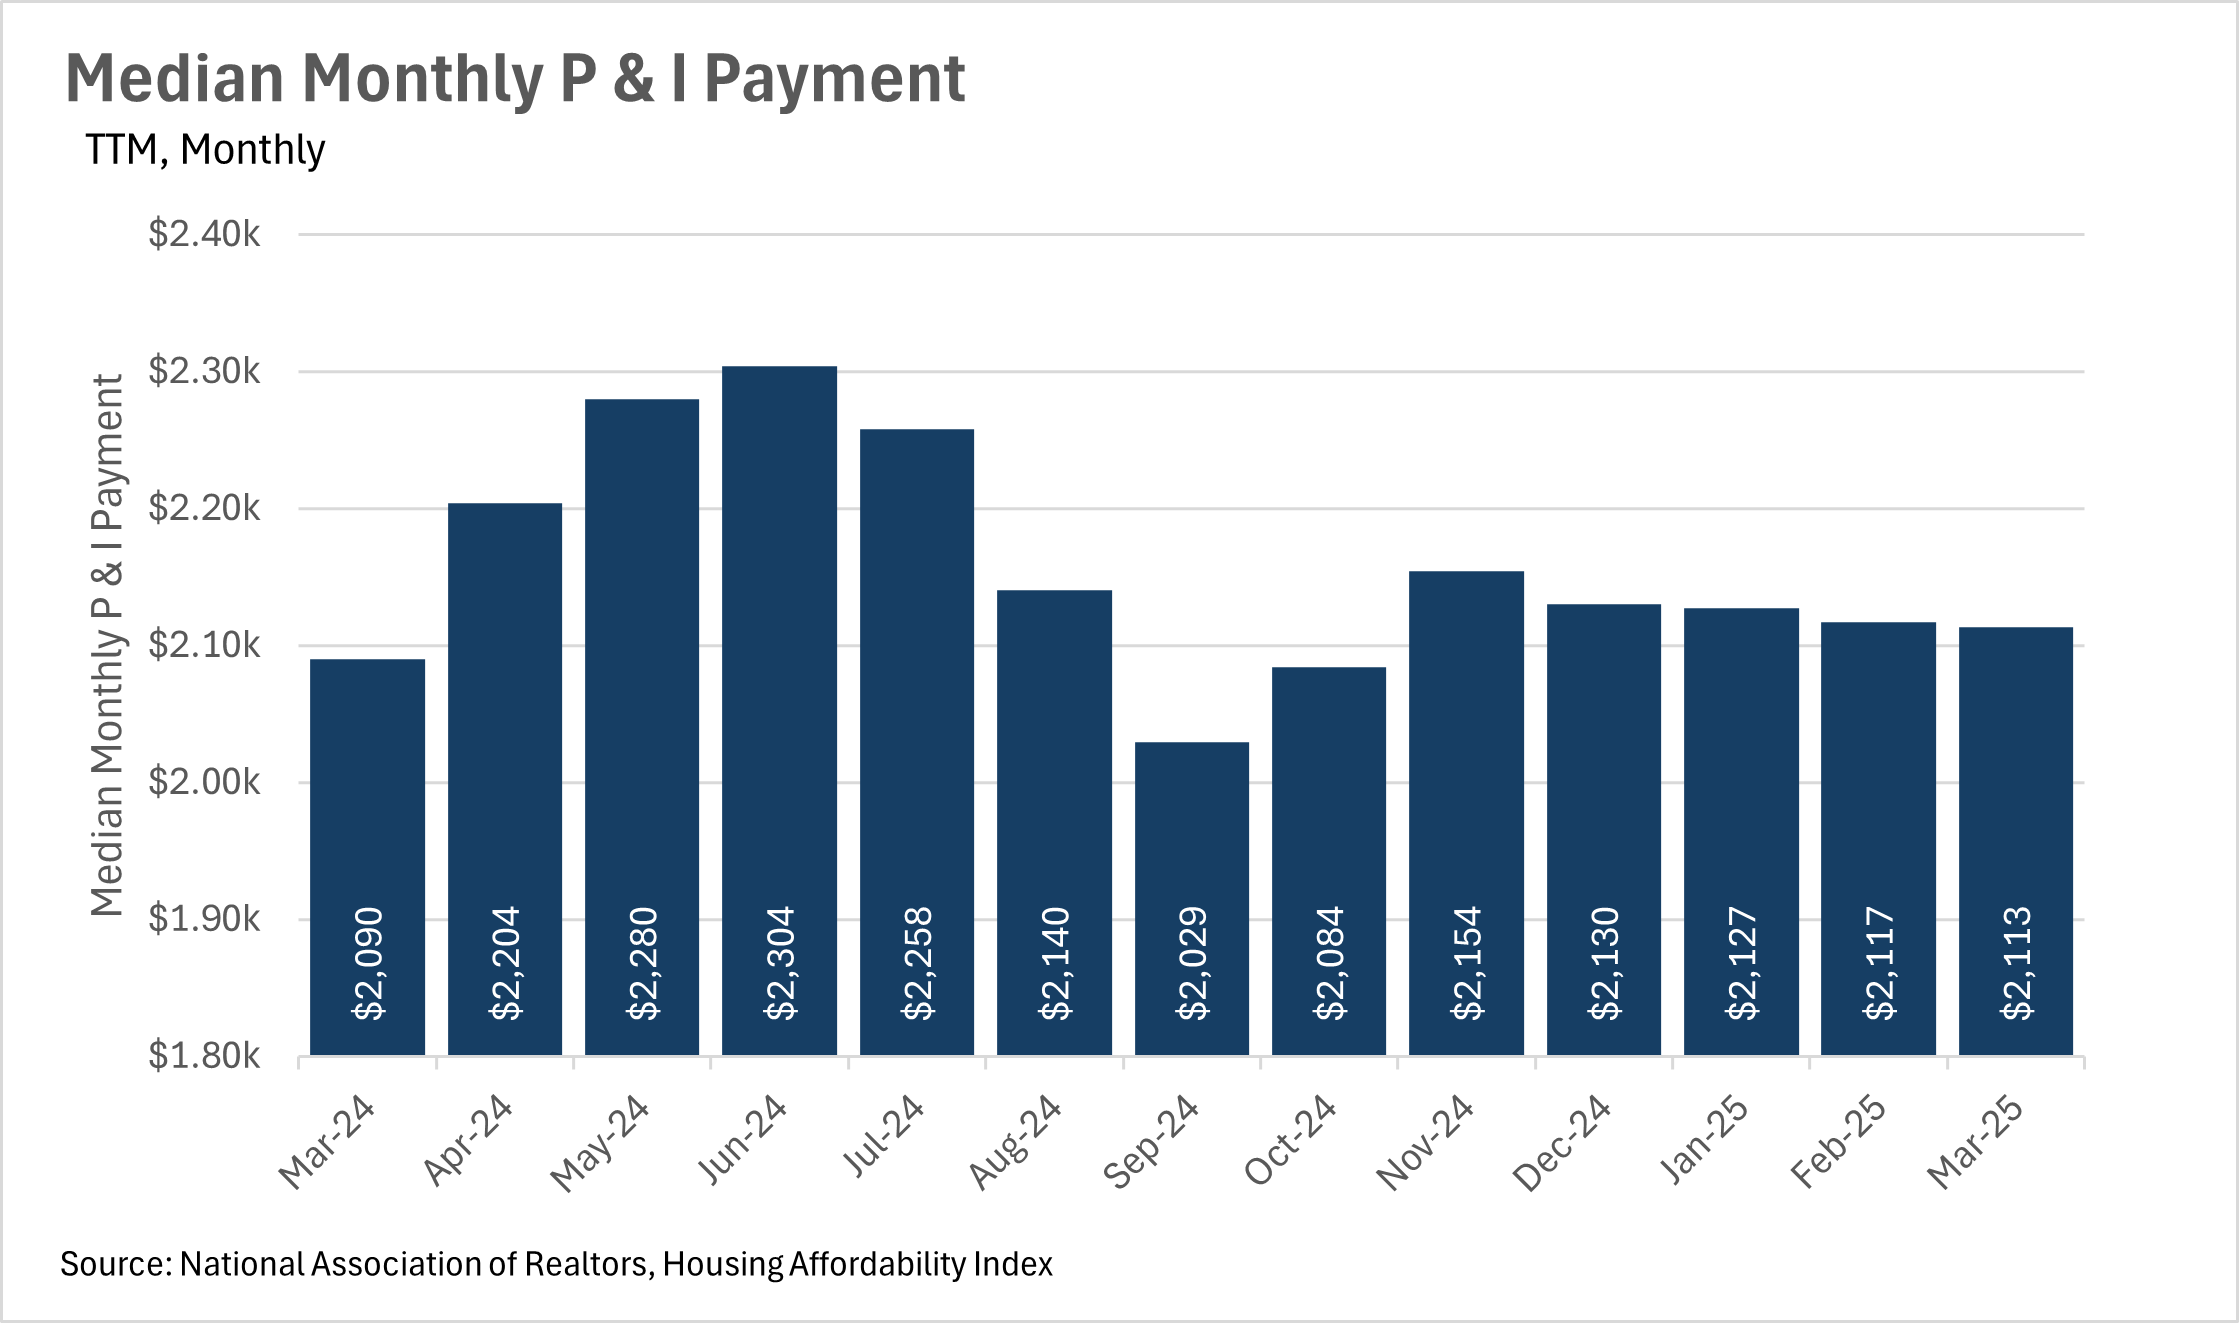
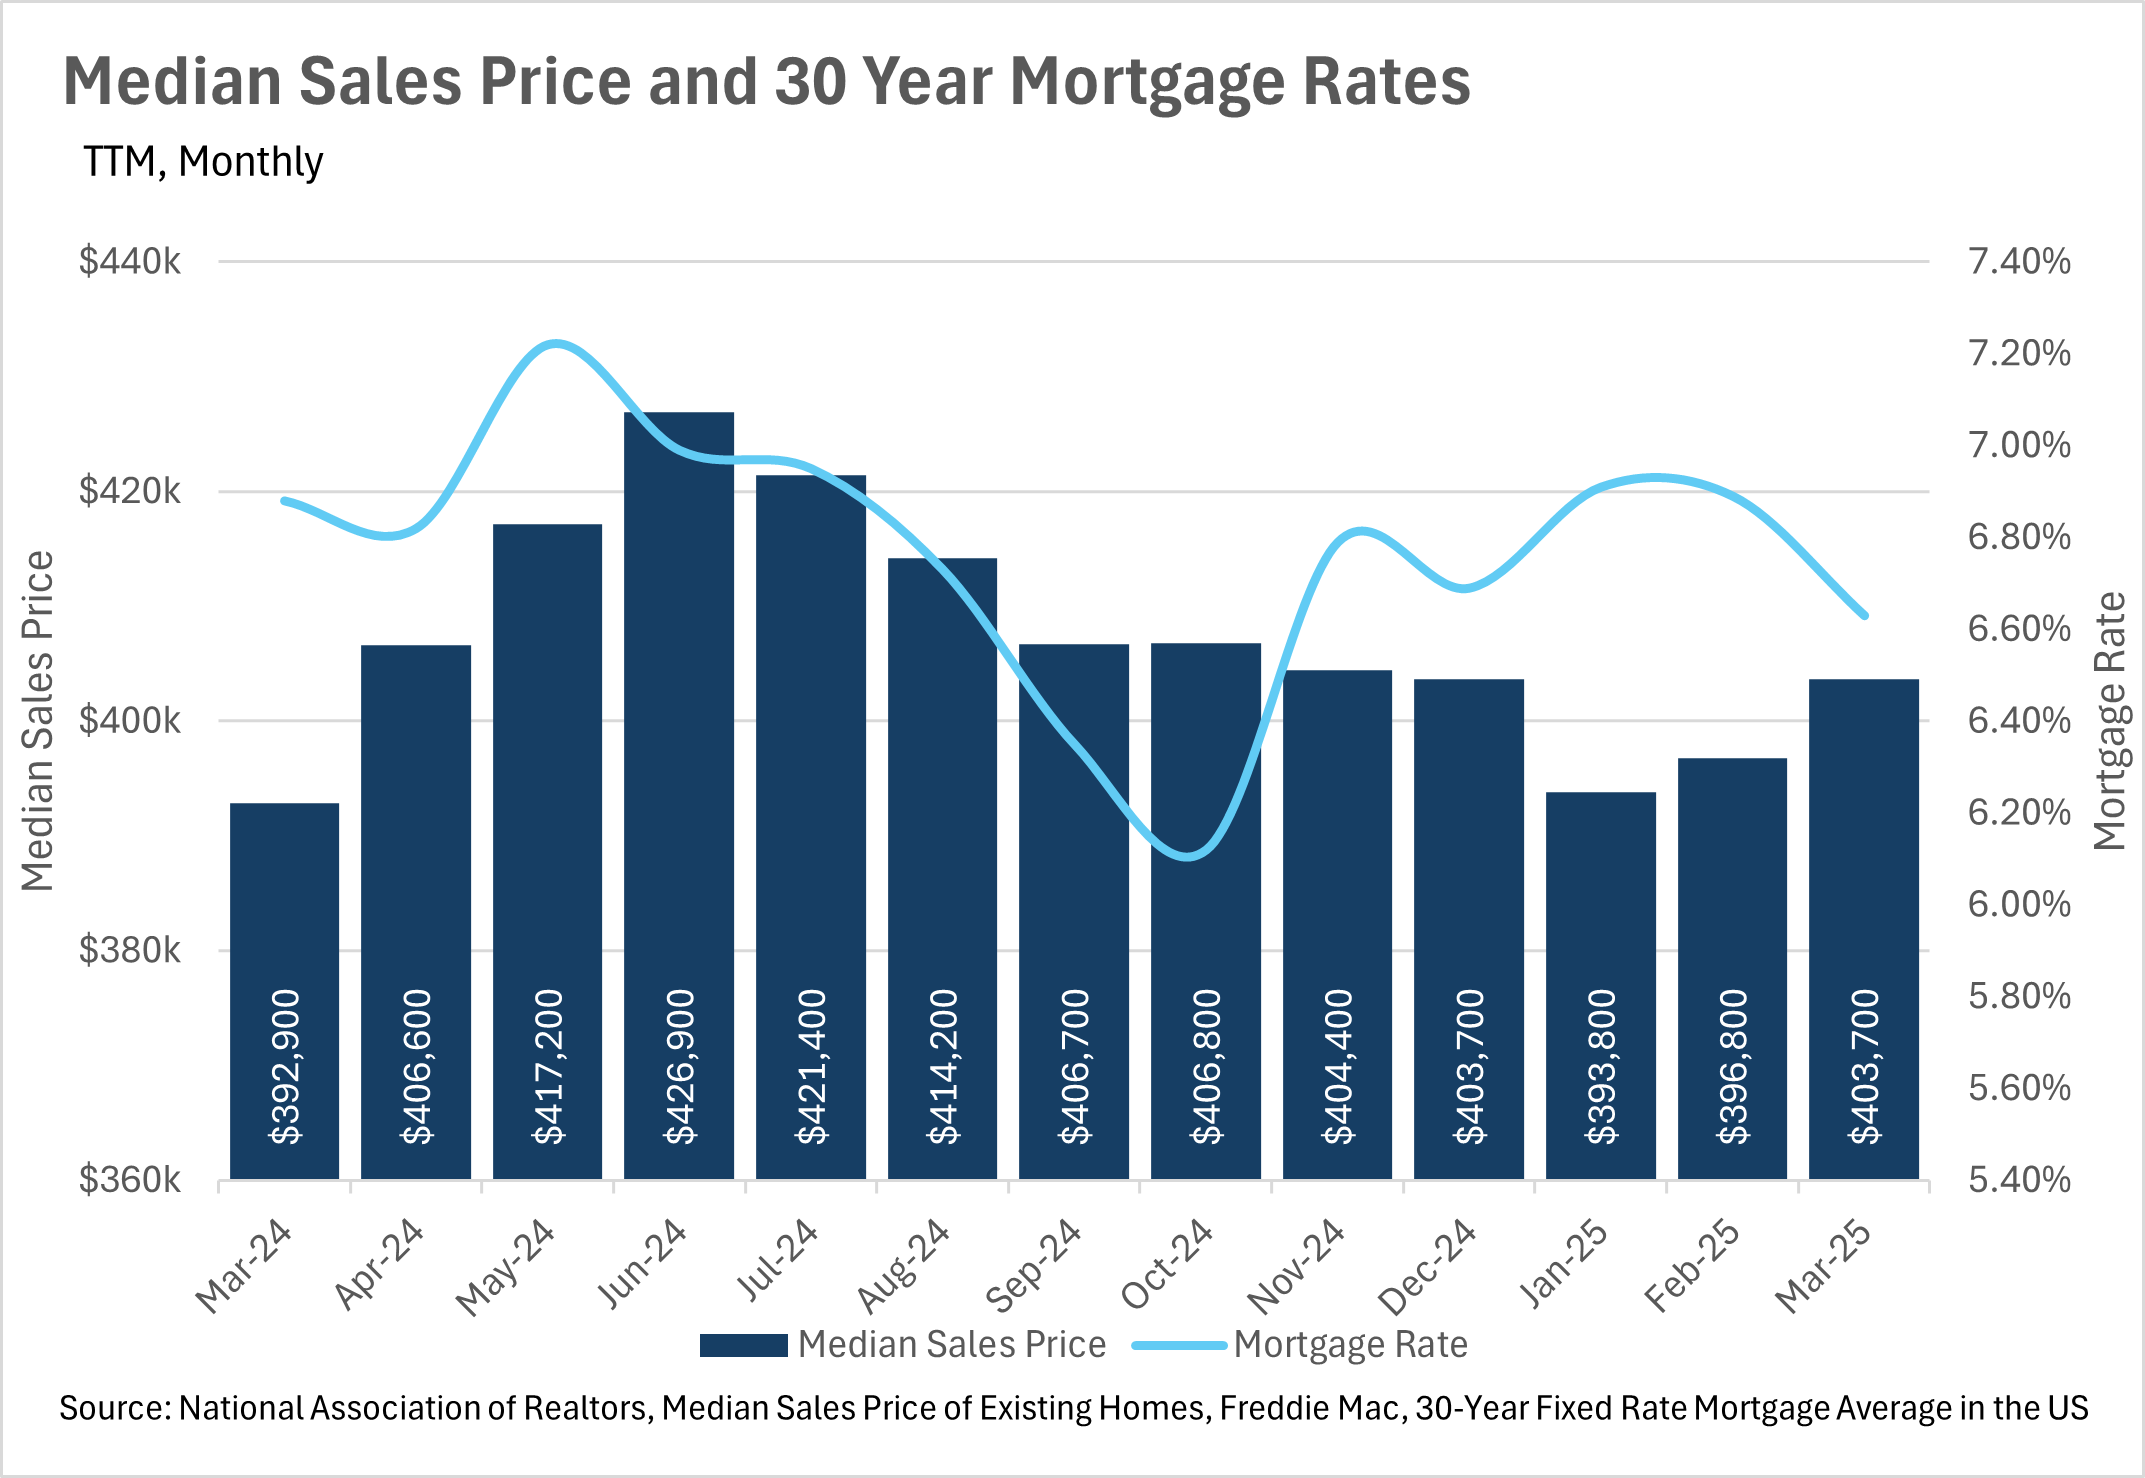
On the bright side, mortgage rates have continued their slow descent, with the average interest rate on a 30-year mortgage in March coming in at around 6.63%, down roughly a quarter point from the year prior. As you might expect, the median monthly P&I payment ticked down slightly, and the median sale price ticked up slightly to match this move.
 
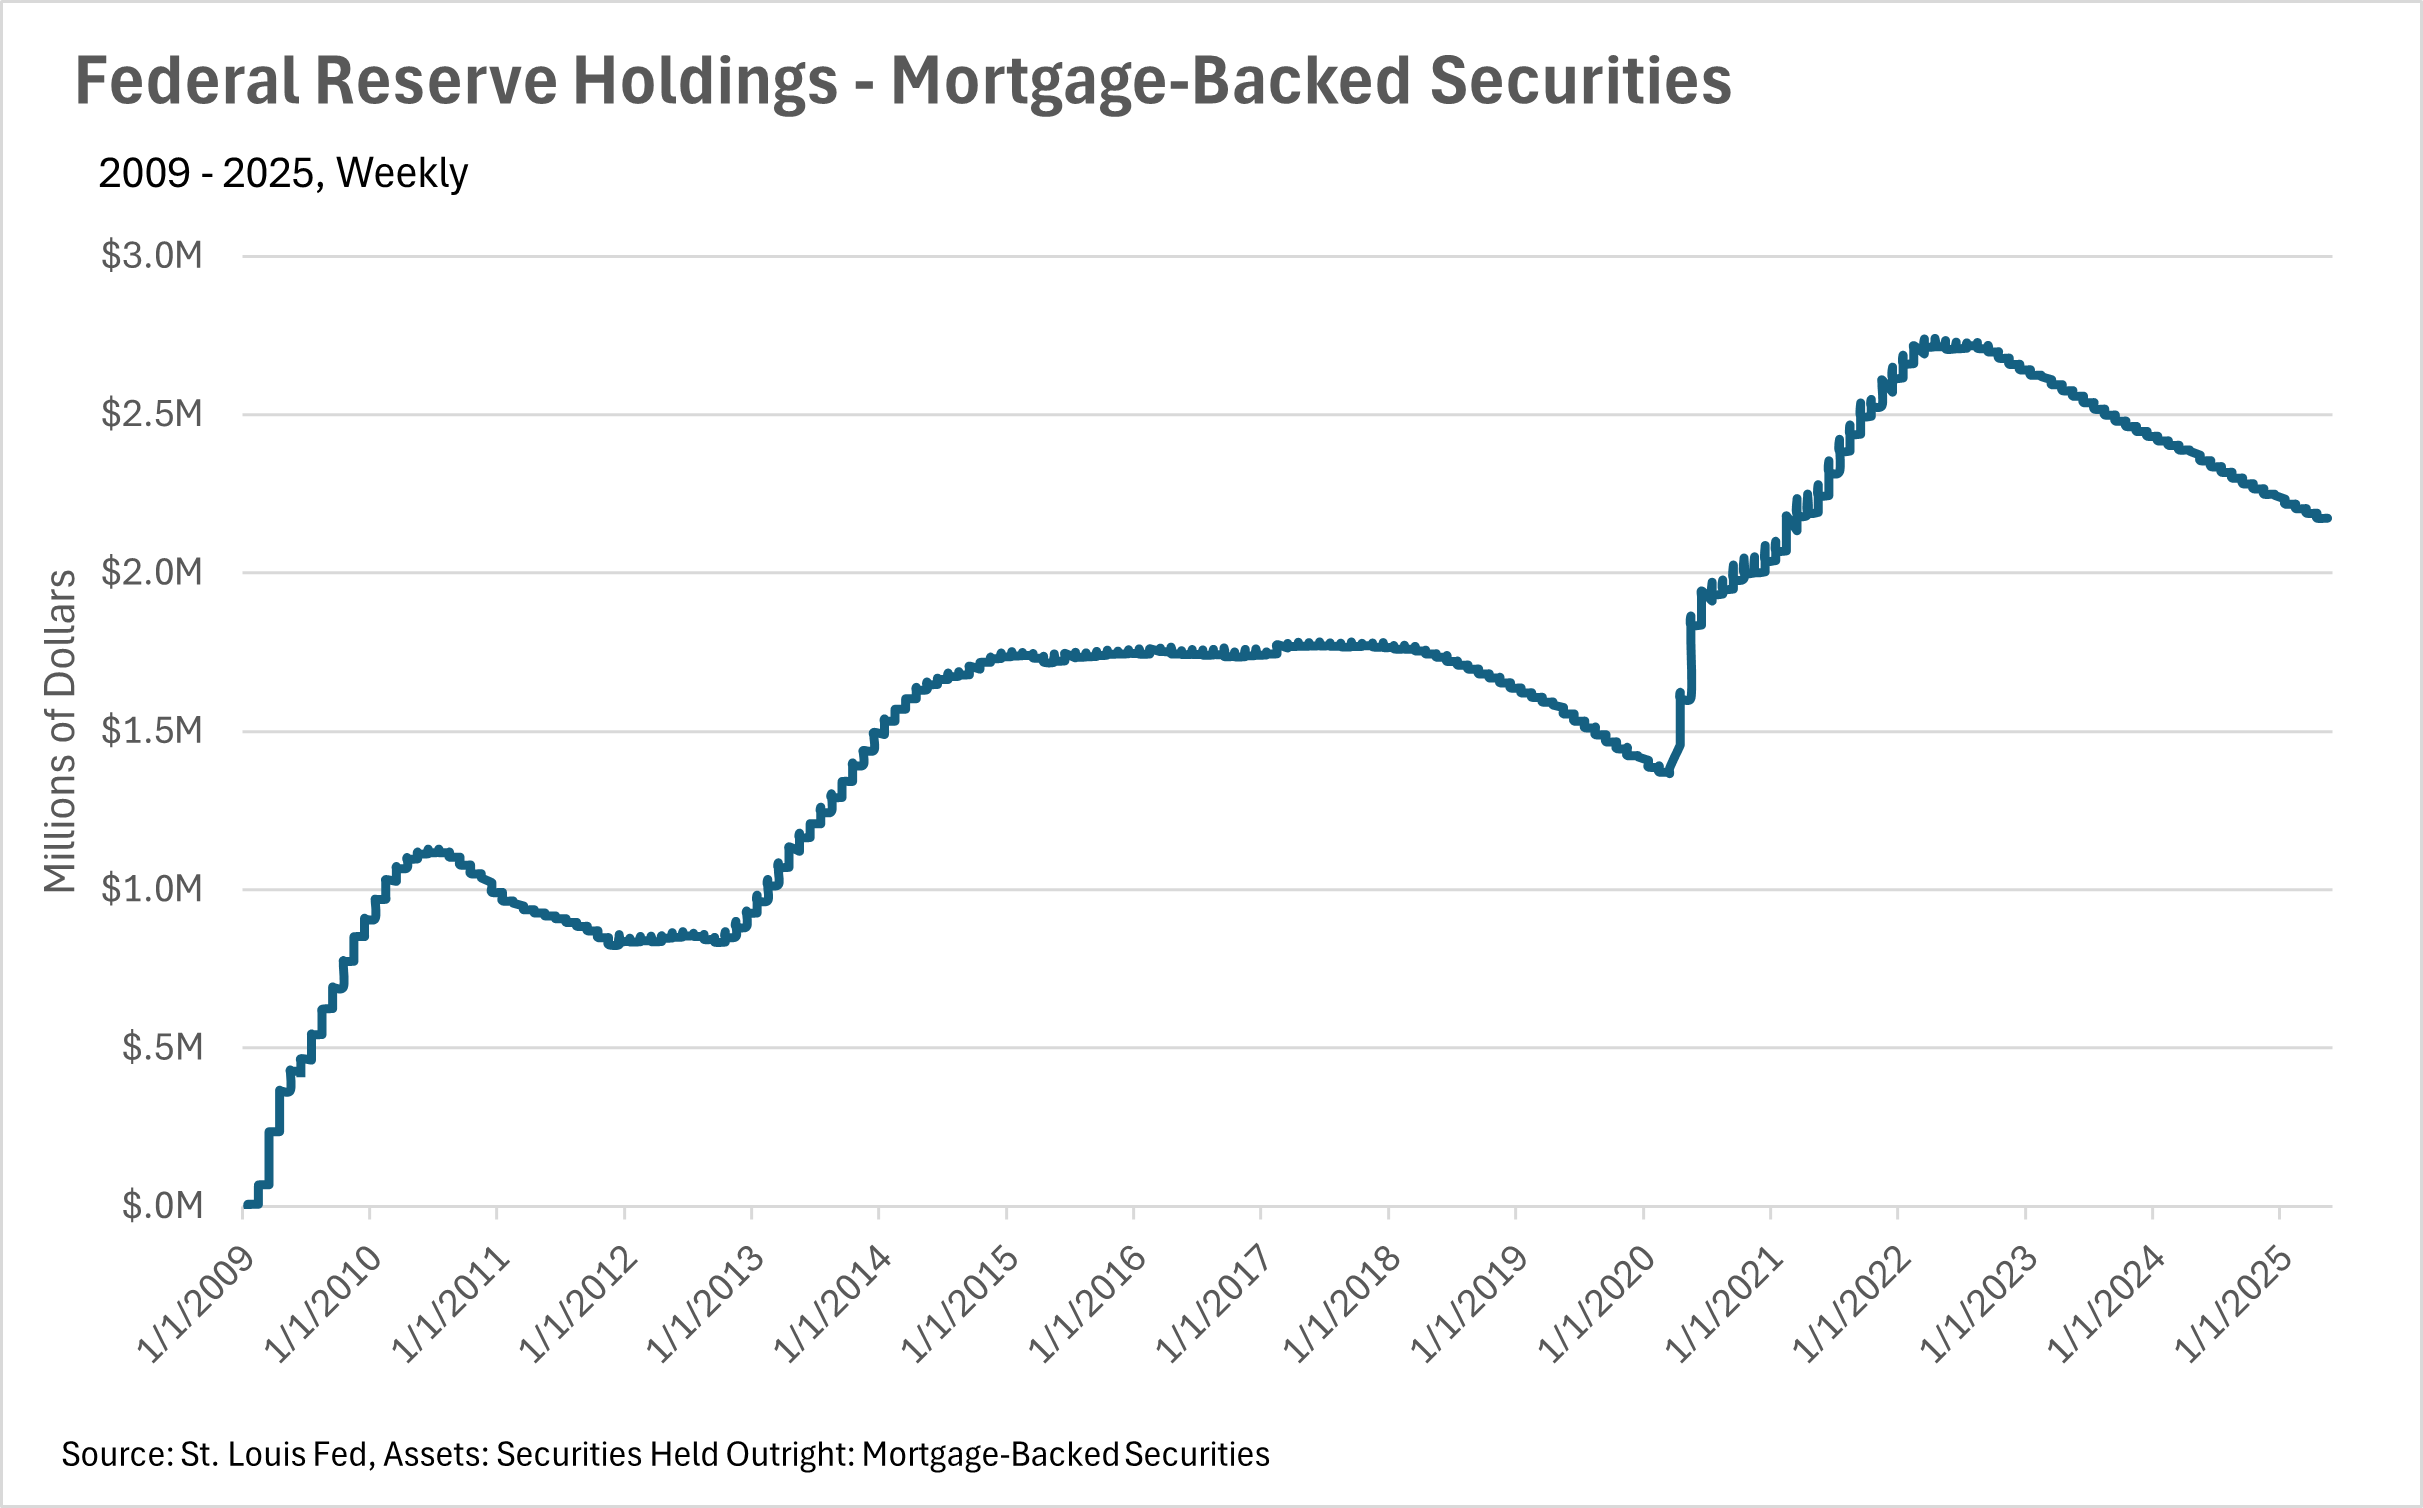
Although mortgage rates have come down a bit, it’s important to remember that the biggest drivers behind mortgage rates are, of course, the 10-year treasury and the federal funds rate. In the most recent Federal Open Market Committee meeting, the Fed has decided to keep the federal funds rate in line with where it’s been over the past few months, despite many Americans feeling the effects of the trade war on their wallets.
 
As we have discussed in prior months, the Fed is in no rush to lower interest rates anytime soon. However, they do see a not-so-distant future where rates are a good bit lower. When you combine this with the fact that inventories are building at a rapid rate, and the number of units being sold has fallen slightly, this could represent a fantastic buying opportunity!
 
Ultimately though, this is just what we’re seeing at a national level. As we all know, real estate is an incredibly localized industry, so knowing what’s going on in your own market is pivotal. Below is our local lowdown, that outlines everything you need to know about what’s happening around you in your neighborhood and surrounding areas!
Big Story Data
The Local Lowdown
Quick Take:
  • Single-family median sale prices in Santa Cruz County have fallen on a year-over-year basis for the first time in over a year.
  • We’re seeing drastic increases in inventory across the board, as new listings flood the market.
  • Despite a flood of new listings hitting the market, homes are still being bought up relatively quickly.
 
Note: You can find the charts/graphs for the Local Lowdown at the end of this section.
Santa Cruz County breaks its winning streak
For over a year, the median sale price for a single-family home increased every single month in Santa Cruz County. However, in the month of April, this streak was unfortunately broken, and we saw quite a decline! The median listing sold for 8.57% less than it did around this time last year. Although this might sound like doom and gloom, it’s perfectly normal and healthy for a market to cool off after it’s been on fire for so long!
 
Additionally, it’s worth noting that the broader Silicon Valley market is performing quite well, with the median homes in San Mateo and Santa Clara Counties selling for 1.69% and 5.50% more than this time last year!
Inventory levels are skyrocketing across the Silicon Valley
This past month, we saw inventory levels continue to grow, as growth in new supply continues to outstrip the growth in demand. In the single-family home market, we saw 8.73% more new listings than a year ago, while there were only 0.79% more closings. When you couple this with the inventory trends that we’ve seen in recent months, we have nearly 30% more inventory on the market than this time last year. Additionally, inventories are at the highest levels we’ve seen in the past two years! The same goes for the condo market, which is currently seeing a surge in new listings and a considerable drop in closed listings, resulting in a 51.29% increase in active inventory on a year-over-year basis!
Despite inventory issues, listings are still being snapped up at a breakneck pace!
Although based on the information we just laid out, you might assume that listings are sitting on the market for a long time, that couldn’t be further from the truth. The average single-family home in Santa Clara County is only on the market for 8 days before it’s bought up! Although not quite as impressive, listings in San Mateo and Santa Cruz Counties aren’t lasting long either, as the average listing only lasts 11 and 15 days, respectively!
 
The condo market is only slightly better, with the average listing on the market for 22 days in San Mateo County, 14 days in Santa Clara, and 30 days in Santa Cruz.
Witty title about Buyers vs. Sellers Markets
When determining whether a market is a buyers’ market or a sellers’ market, we look to the Months of Supply Inventory (MSI) metric. The state of California has historically averaged around three months of MSI, so any area with at or around three months of MSI is considered a balanced market. Any market that has lower than three months of MSI is considered a sellers’ market, whereas markets with more than three months of MSI are considered buyers’ markets.
 
Despite substantial increases in inventory, the single-family home market in San Mateo and Santa Clara Counties remains a seller's market, as there’s only 1.7 months of inventory on the market. However, Santa Cruz County has continued its shift toward favoring the buyers, as the number of months worth of supply has crept up to 3.5. Likewise, the condo market is a buyers' market across the board, with there being 3.2 months' worth of supply on the market in Santa Clara County, 3.5 months in San Mateo, and 5.6 months in Santa Cruz.
Local Lowdown Data
Contact Us
 
Karin Freiman
02201784
500 East Hamilton Ave, 1052 Campbell CA 95008
669-224-0836
karinfreiman.com
All information deemed reliable but not guaranteed. If your property is listed with a real estate broker, this is not a solicitation of brokerage services. Karin Freiman, License 02201784
Agam Real Estate.
 
This email was sent to .
Don't want to receive these anymore? Unsubscribe here.
 
 
Powered by ActivePipe, a MoxiWorks Product

Connect with Karin

Looking to buy, sell, or lease a home? Karin Freiman is here to guide you through every step of the process with expertise, dedication, and clear communication. Reach out today to start your real estate journey with confidence.

Follow Me